Weekly Austin Real Estate Market Update
Austin Real Estate Weekly Market Update - June 19, 2025
by: Dan Price, Broker at Team Price Real Estate
Austin's leading data analysis brokerage, where data drives exceptional service
Published on: Thursday, June 19, 2025 at 11:07 am
Austin’s Real Estate Market : The Austin housing market continues to transition toward more balanced—and in some cases, buyer-favorable—conditions. According to the latest data from Team Price Real Estate, active residential listings across the Austin-Area MLS have reached 17,681, reflecting a 9.3% year-over-year increase. Months of Inventory has climbed to 6.24, up 17.3% from this time last year, indicating slower absorption rates and expanded choices for buyers.
Price trends remain under slight downward pressure. The median sold price across the region has declined 0.8% year over year to $436,500, while the average sold price now stands at $577,716, down 0.4%. In the City of Austin, the median sold price has dropped 3.2% to $600,000, signaling deeper corrections at the median-tier level. With rising inventory, longer days on market, and more room for negotiation, today’s market offers a valuable window of opportunity for buyers—and a strategic planning moment for sellers. For a detailed breakdown across all cities and zip codes, download our full market report featuring hundreds of pages of hyperlocal insights and pricing data across the Austin region.

Austin Real Estate Market Overview
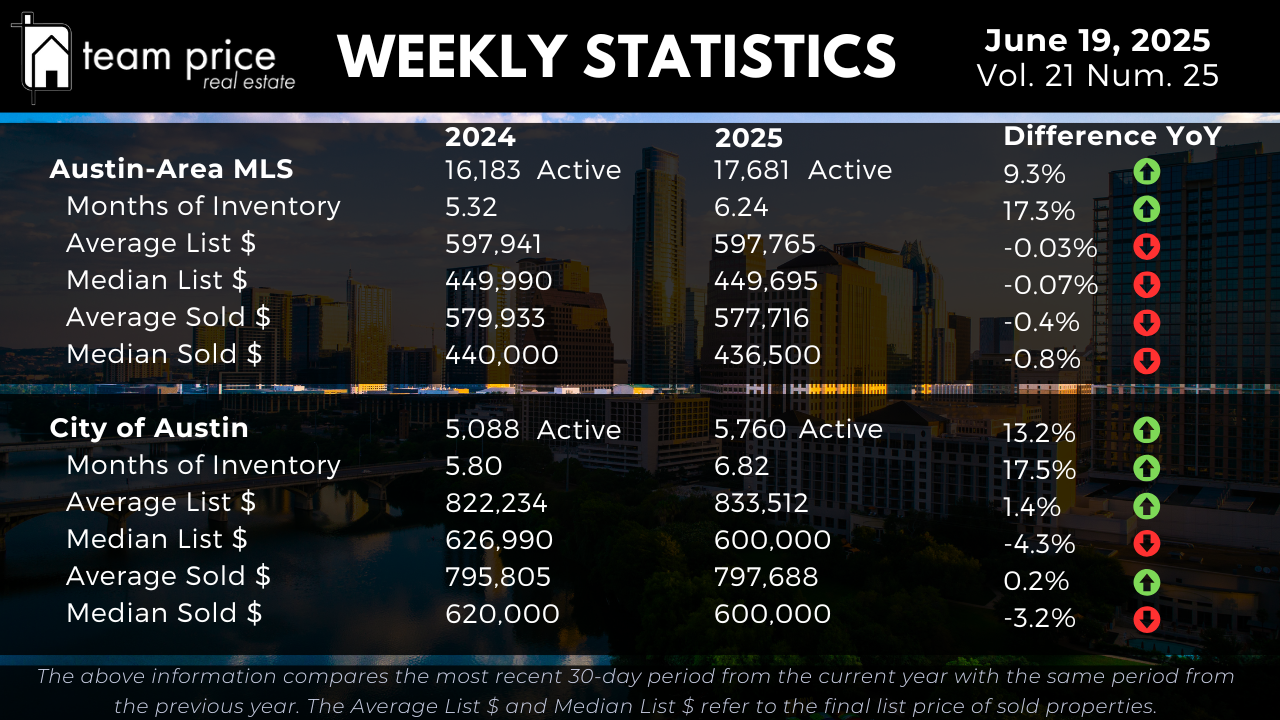
Inventory across the Austin-Area MLS continues to build, reinforcing a sustained shift in the market’s balance. As of this week, there are 17,681 active residential listings—a 9.3% increase from the same period in 2024. Months of Inventory has grown from 5.32 to 6.24, marking a 17.3% rise. This increase in inventory depth reflects both a slower pace of absorption and a steady inflow of new listings. Within the City of Austin, the change is even more pronounced. Active listings have risen by 13.2% year over year to 5,760, and Months of Inventory has increased from 5.80 to 6.82—also a 17.5% gain. These metrics confirm that while buyer activity has moderated, seller activity remains robust, creating a more competitive environment and signaling an ongoing realignment of supply and demand dynamics.
Austin Housing Prices: Gradual Pressure Builds
Across the Austin-area MLS, prices remain relatively stable but continue to show signs of softening under the weight of growing inventory. The average list price is effectively unchanged from a year ago, down just 0.03% to $597,765. The average sold price has declined slightly to $577,716, a 0.4% year-over-year decrease. The median list price sits at $449,695, down 0.07%, while the median sold price is now $436,500, down 0.8%. These small but persistent declines are consistent with a market that has lost momentum but not value entirely.
In the City of Austin, price performance is mixed depending on segment. The average list price has increased 1.4% year over year to $833,512, likely driven by higher-priced inventory. At the same time, the median list price has dropped 4.3% to $600,000, indicating that mid-range listings are under more pressure. The average sold price is virtually flat, up just 0.2% to $797,688, while the median sold price has declined 3.2% to $600,000. This continued divergence between average and median pricing underscores a segmentation where luxury or turnkey homes continue to attract attention, but broader affordability headwinds are weighing down the middle of the market.
Regional Trends: Price Gains Uneven Across Central Texas
Regional pricing trends remain fractured. Of the 30 cities tracked across Central Texas, 60% (18 cities) experienced month-over-month price gains, while 37% (11 cities) saw month-over-month declines. However, year-over-year trends reveal more stagnation: 50% of cities recorded price increases over the past year, while the other half saw declines. Notably, none of the 30 cities remain above their pricing peak from the past 12 months—every one has experienced some level of retracement.
At the ZIP code level, similar patterns emerge. Among the 75 ZIP codes monitored, 51% saw month-over-month price gains while 48% declined. On a year-over-year basis, 43% (32 ZIP codes) posted price increases, while 57% (43 ZIP codes) experienced declines. Just one ZIP code remains above its 12-month high, indicating that the post-peak correction is still broadly felt across the region. These regional figures highlight a leveling market with scattered recovery signals, but no clear upward momentum.
List-to-Sale Price Performance: Modest Negotiation Continues
The majority of homes in the Austin-area MLS continue to sell below asking price. As of June 19, 2025, 66.88% of closed sales were below list, compared to 62.85% the previous month and 63.42% one year ago. Sales at list price account for 20.75% of transactions, while only 12.38% of homes sold above list—a continued monthly and annual decline. The average sold-to-list price ratio is now 97.29%, reflecting steady negotiation margins and pricing realism by sellers. Homes that are competitively priced and well-positioned continue to draw attention, but in general, the market remains defined by price sensitivity and strategic buyer behavior.
Peak Value Trends: Still Well Below the Top
The Austin market continues to operate below its peak values across nearly all major pricing metrics. In the Austin-Area MLS, the average list price peaked at $719,023 in April 2025 and has since declined to $667,891—a 7.1% drop. The median list price has fallen 11.1% from its May 2022 peak of $539,900 to $479,900. On the sold side, the average sold price is down 12.6% from its May 2022 peak of $664,515 to $581,035. The median sold price has declined 15.7%, from $538,000 to $453,610. Price per square foot has also taken a hit: the average has dropped 19.8%, from $324 to $260, and the median has fallen 21.4%, from $280 to $220.
The City of Austin follows a similar trajectory. The average list price hit a peak of $953,977 in April 2025 and now sits at $847,208, down 11.2%. The median list price has decreased 11.8%, from $669,000 to $589,900. The average sold price is down 7.9% from its May 2022 peak of $847,583 to $780,215, while the median sold price has dropped 11.8%, from $680,000 to $600,000. Price per square foot in the city has also declined notably: the average is down 19.0%, from $442 to $358, and the median is down 20.6%, from $393 to $312. These figures confirm that while pricing has stabilized in recent months, the broader correction from peak remains firmly in place.
Austin Area Residential Sales Insights
Austin Real Estate FAQ: June 19, 2025
1. Is Austin experiencing a housing correction in 2025?
Yes, the data continues to reflect a market correction, not a crash. As of June 19, 2025, active listings across the Austin-Area MLS have risen 9.3% year over year, now totaling 17,681. Months of Inventory has climbed from 5.32 to 6.24, a 17.3% increase, signaling a slower pace of sales and expanding supply. Prices have followed with moderate declines: the median sold price across the region is now $436,500, down 0.8% from one year ago, and down more than 15% from the May 2022 peak of $538,000. In the City of Austin, the median sold price has fallen 3.2% annually. This correction is broad-based but measured, and continues to improve affordability and buyer leverage without showing signs of systemic distress.
2. Are most homes in Austin selling below list price in 2025?
Yes. As of mid-June 2025, 66.88% of all sold properties in the Austin-Area MLS have sold below their asking price. This trend has grown month over month, up from 62.85% in May. Only 12.38% of properties sold above list price, down from 14.89% last month and 13.74% in June 2024. The average sold-to-list price ratio is currently 97.29%, underscoring that most buyers are negotiating below asking price. This shift is being driven by high inventory, longer days on market, and fewer bidding wars—conditions typical of a neutral to buyer-leaning market.
3. Which Austin neighborhoods or zip codes are seeing the biggest home price declines?
Across the 75 zip codes tracked in Central Texas, 74 have declined in price from their peak. Only one zip code has shown a price increase since then. Year over year, 43 out of 75 zip codes (57%) have seen price decreases. The median sold price per square foot across the region is down over 21% from the April 2022 peak, with the average price per square foot down nearly 20%. These figures indicate that the correction has touched nearly every corner of the metro area, especially neighborhoods that had outsized appreciation during the 2020–2022 boom.
4. Are any parts of the Austin housing market still seeing price growth?
Yes, but it’s limited. Of the 30 cities in the Central Texas region tracked by Team Price Real Estate, 18 cities—or 60%—have seen month-over-month price increases. However, only 15 of the 30 cities (50%) posted year-over-year price gains. This suggests that while some areas are stabilizing or seeing seasonal rebounds, long-term appreciation remains elusive. In the zip code analysis, just 32 out of 75 zip codes posted year-over-year gains, and only one zip code is up from its 12-month peak. This emphasizes that local micro-markets are behaving differently, and buyers need to watch neighborhood-level trends closely.
5. How much inventory is currently available in Austin and what does that mean?
Inventory is the highest it's been in several years. The Austin-Area MLS now has 17,681 active listings—up from 16,183 a year ago. In the City of Austin, inventory rose 13.2%, from 5,088 to 5,760 listings. Months of Inventory, which measures the pace of the market, has reached 6.24 across the region and 6.82 in the city—a 1.2x increase year over year. A market with 5 to 7 months of inventory is generally considered balanced, but the current trend leans slightly in favor of buyers. More inventory gives buyers increased negotiating power, reduces urgency, and lowers the chance of bidding wars.
6. Are Austin home prices still falling from their peak?
Yes, and the declines remain significant in both price and price per square foot. Since peaking in May 2022, the median sold price in the Austin-Area MLS has dropped from $538,000 to $453,610—a decline of 15.7%. The average sold price has dropped from $664,515 to $581,035, down 12.6%. In the City of Austin, the median sold price has fallen from $680,000 to $600,000, a drop of 11.8%. These reductions indicate that the market has undergone a multi-year correction, though the pace of decline has slowed in recent months.
7. What’s happening with list prices in Austin in June 2025?
List prices are mostly flat or declining slightly. In the Austin-Area MLS, the average list price is down just 0.03% from one year ago, now at $597,765. The median list price is also slightly down by 0.07%, sitting at $449,695. In the City of Austin, trends are more mixed. The average list price rose 1.4% to $833,512, while the median list price dropped 4.3% to $600,000. This bifurcation suggests that luxury and higher-end sellers remain optimistic, but median-tier sellers are responding to buyer pushback and adjusting expectations.
8. How is buyer activity comparing to new listings in Austin?
Buyer activity continues to lag new listings. Cumulatively, new listings in 2025 remain elevated compared to historic averages, while pending sales have softened. This growing gap is causing inventory to build. With fewer buyers relative to new supply, many sellers are facing extended days on market and are increasingly turning to price reductions to attract attention. Until buyer demand rebounds more forcefully, especially in the mid-price range, inventory will likely continue climbing.
Latest Articles
- All Articles
- buyers
- real estate
- Austin real estate buyers
- buying a home
- selling your home
- real estate agent